
Some things are easier to visualize than others. Visualizing the portion of our income that is taken in taxes, for example, is relatively straightforward. First the money was there, and then it went somewhere else. But what about money that was never there in the first place? As a result of the burden of overregulation, hundreds of billions of dollars in goods and services are never created at all in this country every year. Companies are less able to hire workers as a result, and consumers ultimately pay these regulatory costs in the form of higher prices for goods and services – everything from the home electric bill, to food, clothing and medical care.
In a new graphic from The LIBRE Institute, we illustrate the size of regulatory compliance costs on U.S. businesses compared to major U.S. industries as a share of total GDP. Strikingly, the cost of overregulation consumes more than a tenth of the economy every single year, and regulations continue to add up. For Hispanic entrepreneurs struggling to get off the ground, all that added cost takes a toll.
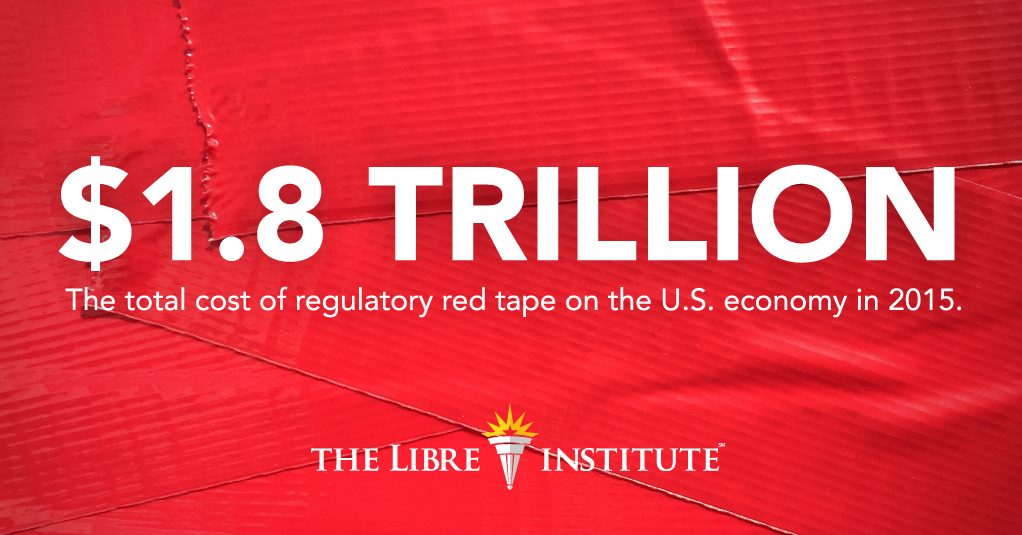
Using data from the Bureau of Economic Analysis, we compare the size of the construction, health care, and financial and insurance industries with the size of total U.S. regulatory compliance costs as a share of GDP. In 2015, the total burden of regulatory compliance costs in the U.S. exceeded 10 percent of GDP. In fact, the total cost of red tape in the United States surpassed $1.8 trillion in 2015, a figure larger than the entire GDP of Russia. If red tape in the United States were a country, it would be larger than all but the world’s 8 largest economies.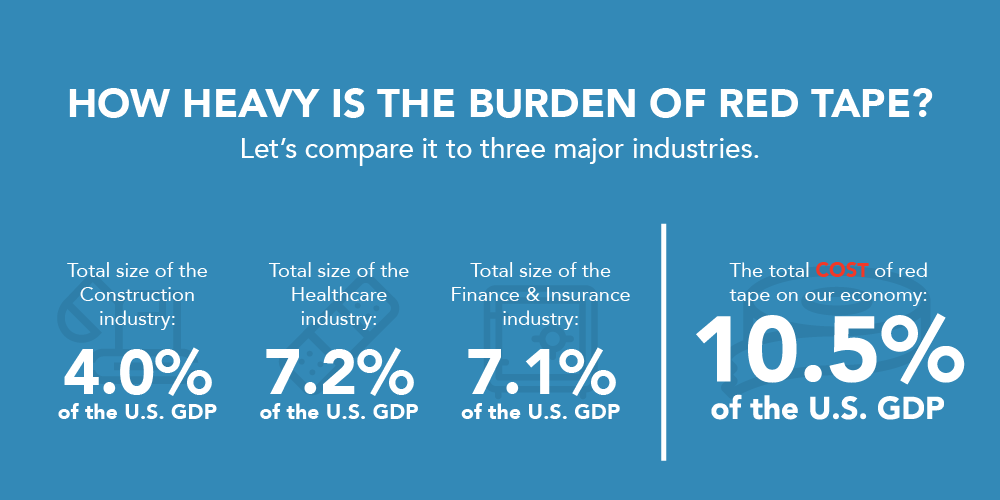 All of these regulatory costs take their toll on businesses, and in fact systematically benefit large businesses at the expense of their smaller competitors. According to the American Action Forum, “for every 10 percent increase in regulatory costs in an industry, the number of small and medium-size businesses in that industry falls 3 to 6 percent. The number of large businesses, meanwhile, grows 2 to 3 percent. In sum, … regulations cumulatively have a highly regressive effect, substantially reducing the smallest businesses and growing the largest.” Making matters worse, overregulation doesn’t just worsen inequality – it seriously holds back growth as well. According to recent estimates by the Mercatus Center at George Mason University, the total burden of regulations on economic growth constitutes a drag of .8 percent annually. That may not sound like much, but it piles up over time. In fact, if regulations had been held at constant levels observed when Ronald Reagan was elected in 1980, the U.S. economy would be nearly 25 percent larger than it is today – a difference of $13,000 per capita. Far from tweaking the market to make it work better for everyone, government regulations seem to do more harm than good.
Hispanic entrepreneurs lead the nation in creating new businesses, but the startup rate is declining. At the same time, the burden of regulations in the United States continues to grow with every passing year. If policymakers want to safeguard the growth and financial future of the United States, the data shows that the way to do that is to remove regulations, not add them.